
Often you want to display some data in its geographic context. You can produce a range of simple maps in R with the maps and mapdata packages.
For example, to show the location of the IMAS Sandy Bay on a map of Australia
library(maps)library(mapdata)map("worldHires",xlim=c(110,160),ylim=c(-45,-10))points(147.32785,-42.901103,pch=16,col="red")
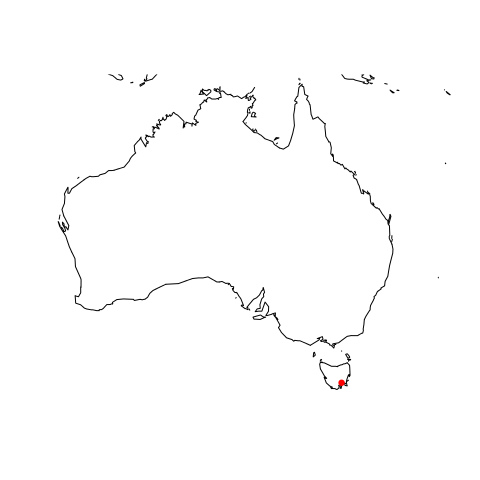
IMAS Sandy Bay
If you need an alternate projection, use the mapproj package. To show the location of the IMAS projection on a stereographic projection about the pole, rotated to place Tasmania at the top of the plot
library(maps)library(mapdata)library(mapproj)proj <- "stereographic"orient <- c(-90,147.32,0)map("worldHires",projection=proj,orientation=orient,ylim=c(-90,-40))points(mapproject(147.32785,-42.901103,projection=proj,orientation=orient),pch=16,col="red")
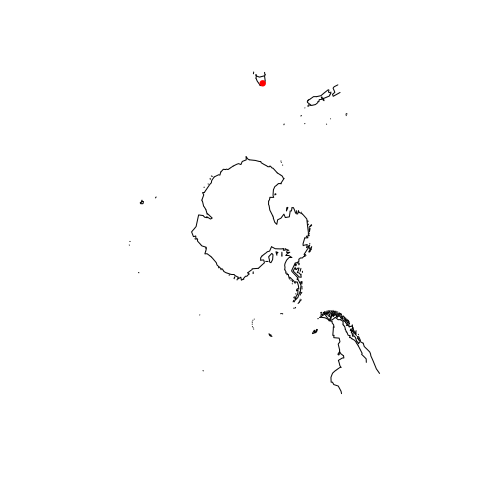
IMAS Sandy Bay