
Overplotting is when one point in a plot obscures another, giving a misleading impression of the density of the data in that area. Overplot is a common problem for larger data sets, or when the data are discrete.
For discrete data, the problem of overplot can often be solved through jittering. For discrete data overplot occurs because some points are exact duplicates of others. Jittering adds a small random offset to each point, rendering the duplicates distinct. Alternately, we can vary the plot symbol to represent the number of duplicated points the symbol represents – this is the approach taken by the sunflowerplot function, and the slightly more effective sizeplot function from the plotrix library.
For continuous data, if the overplot is not severe, it sometimes suffices to simply use a smaller symbol to represent the points. Many statistical packages use a small circle to represent points in a plot – but for even moderate sized data sets this can lead to overplot. But if the data set is not too large the overplot can be reduced to an acceptable level by representing points as dots.
For very large data sets more imaginative solutions are required. One solution is to use alpha transparency. If we plot points in light grey, then when they overplot they just remain light grey. Alpha transparency allows us to treat points as if they are translucent – if we plot a single point it appears light grey, but where two points overlap they appear darker, and the more points that overlap, the darker they appear. Sarkar(2008) gives the following example.
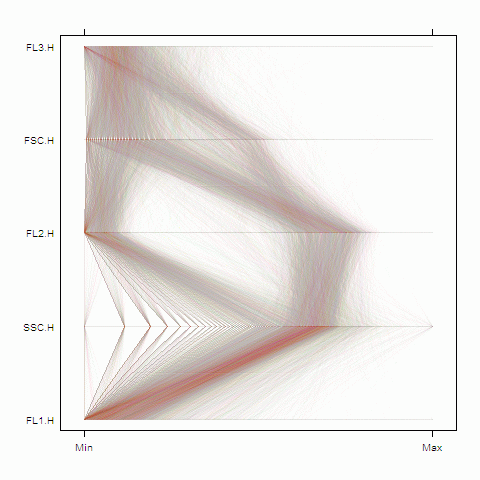
Using alpha transparency to represent plot density
Without alpha transparency this plot would appear a uniform grey, but in this form the greyscale gives an indicator of line density.
Unwin et al(2006) discuss the problem of plotting large data sets in general.