
For the recent Bayesian Analysis workshop, I wanted to created a figure consisting of two subplots, with corresponding features of the two plots linked by lines, as shown below:
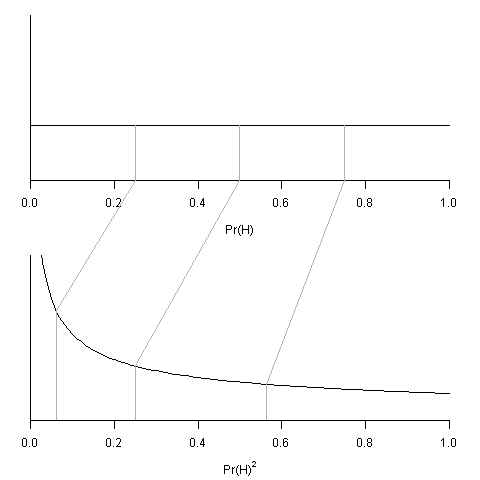
Linked Subplots in R
The figure is meant to represent the effect of a change of variable – the grey lines in the upper figure are linked to their new locations after the change of variable in the lower figure.
To contruct a figure like this, you need to know that when R draws a figure with several subplots:
- By default R “clips” or limits any drawing to the body of the current subplot. No matter what you try to draw, R will not draw outside the bounds of the current subplot. Clipping can be disabled by setting the graphical parameter xpd to ‘NA’.
- R maintains several coordinate systems for each subplot – “user coordinates” are defined by the data being plotted, “normalized figure coordinates” map (0,0) to the lower left of the subplot, and (1,1) to the upper right of the subplot, and “normalized device coordinates” map (0,0) to the lower left of the entire figure, and (1,1) to the upper right of the entire figure. We can convert between these coordinate systems with the
grconvertXandgrconvertYfunctions.
So to produce the figure above, we must
- Draw the upper plot
- Record the normalized device coordinates of the bottom ends of the vertical grey lines
- Draw the lower plot
- Convert the coordinates recorded in step 2 back to user coordinates for the current subfigure, and use these to draw the connecting lines with clipping turned off.
Try executing the code below block by block.
## Create a 2 x 1 layoutopar <- par(mfrow=c(2,1),mar=c(4,2,1,2)+0.1)## Create the upper subplotxr <- c(0.25,0.5,0.75)x <- seq(0,1,length=100)plot(x,rep(1,length(x)),type="l",axes=F,xlab=expression("Pr(H)"),ylab="",xlim=c(0,1),ylim=c(0,3),xaxs="i",yaxs="i")segments(xr,0,xr,1,col="grey70")box(bty="l")axis(1)## Record coordinatesx0 <- grconvertX(xr,"user","nic")y0 <- grconvertY(rep(0,length(xr)),"user","nic")## Create lower plotplot(x,1/(2*sqrt(x)),type="l",axes=F,xlab=expression("Pr(H)"^2),ylab="",xlim=c(0,1),ylim=c(0,3),xaxs="i",yaxs="i")segments(xr^2,0,xr^2,1/(2*sqrt(xr^2)),col="grey70")box(bty="l")axis(1)## Add lines joining the plots. Must turn clipping off.segments(grconvertX(x0,"nic","user"),grconvertY(y0,"nic","user"),xr^2,1/(2*sqrt(xr^2)),col="grey70",xpd=NA)## Revert to default layoutpar(opar)