
A recent article looked at producing simple maps in R. Here’s one way of doing similar things using Matlab.
These examples use the freely-available m_map package. First download this package and ensure that it is on your Matlab path (‘help addpath’).
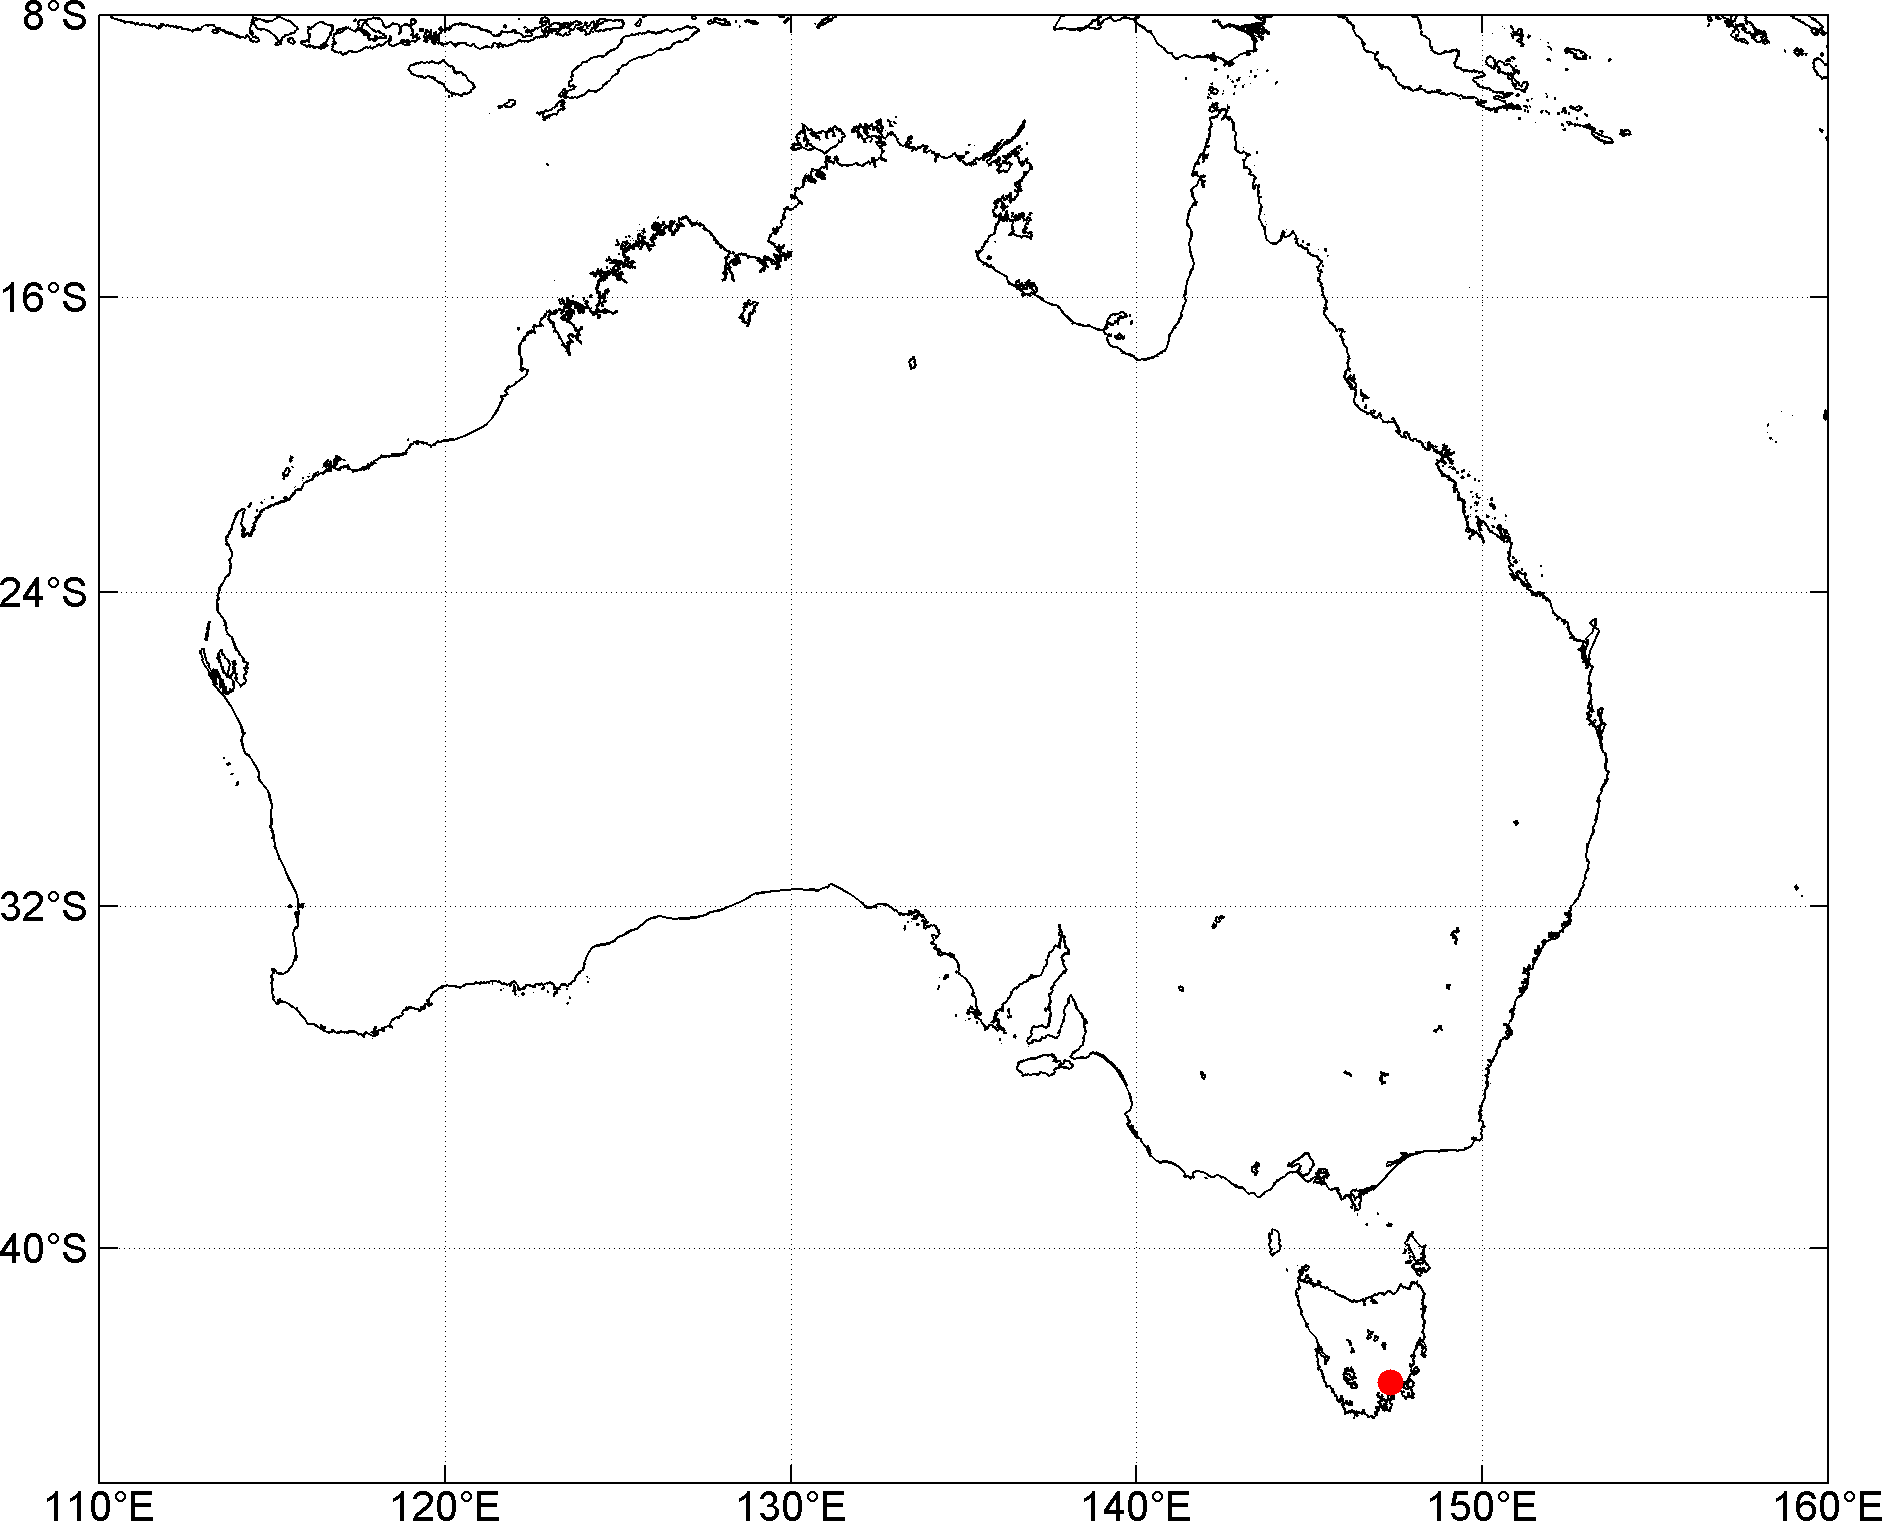
To show the location of the IMAS Sandy Bay on a map of Australia:
m_proj('mercator','lon',[110 160],'lat',[-45 -8]);figurem_gshhs_i('line','Color','k') % plot coastline at intermediate resolution, as black linehold onph=m_plot(147.32785,-42.901103,'r.'); % plot IMAS locationset(ph,'MarkerSize',20); % make the point largerm_grid % add the map gridlines and tick marks
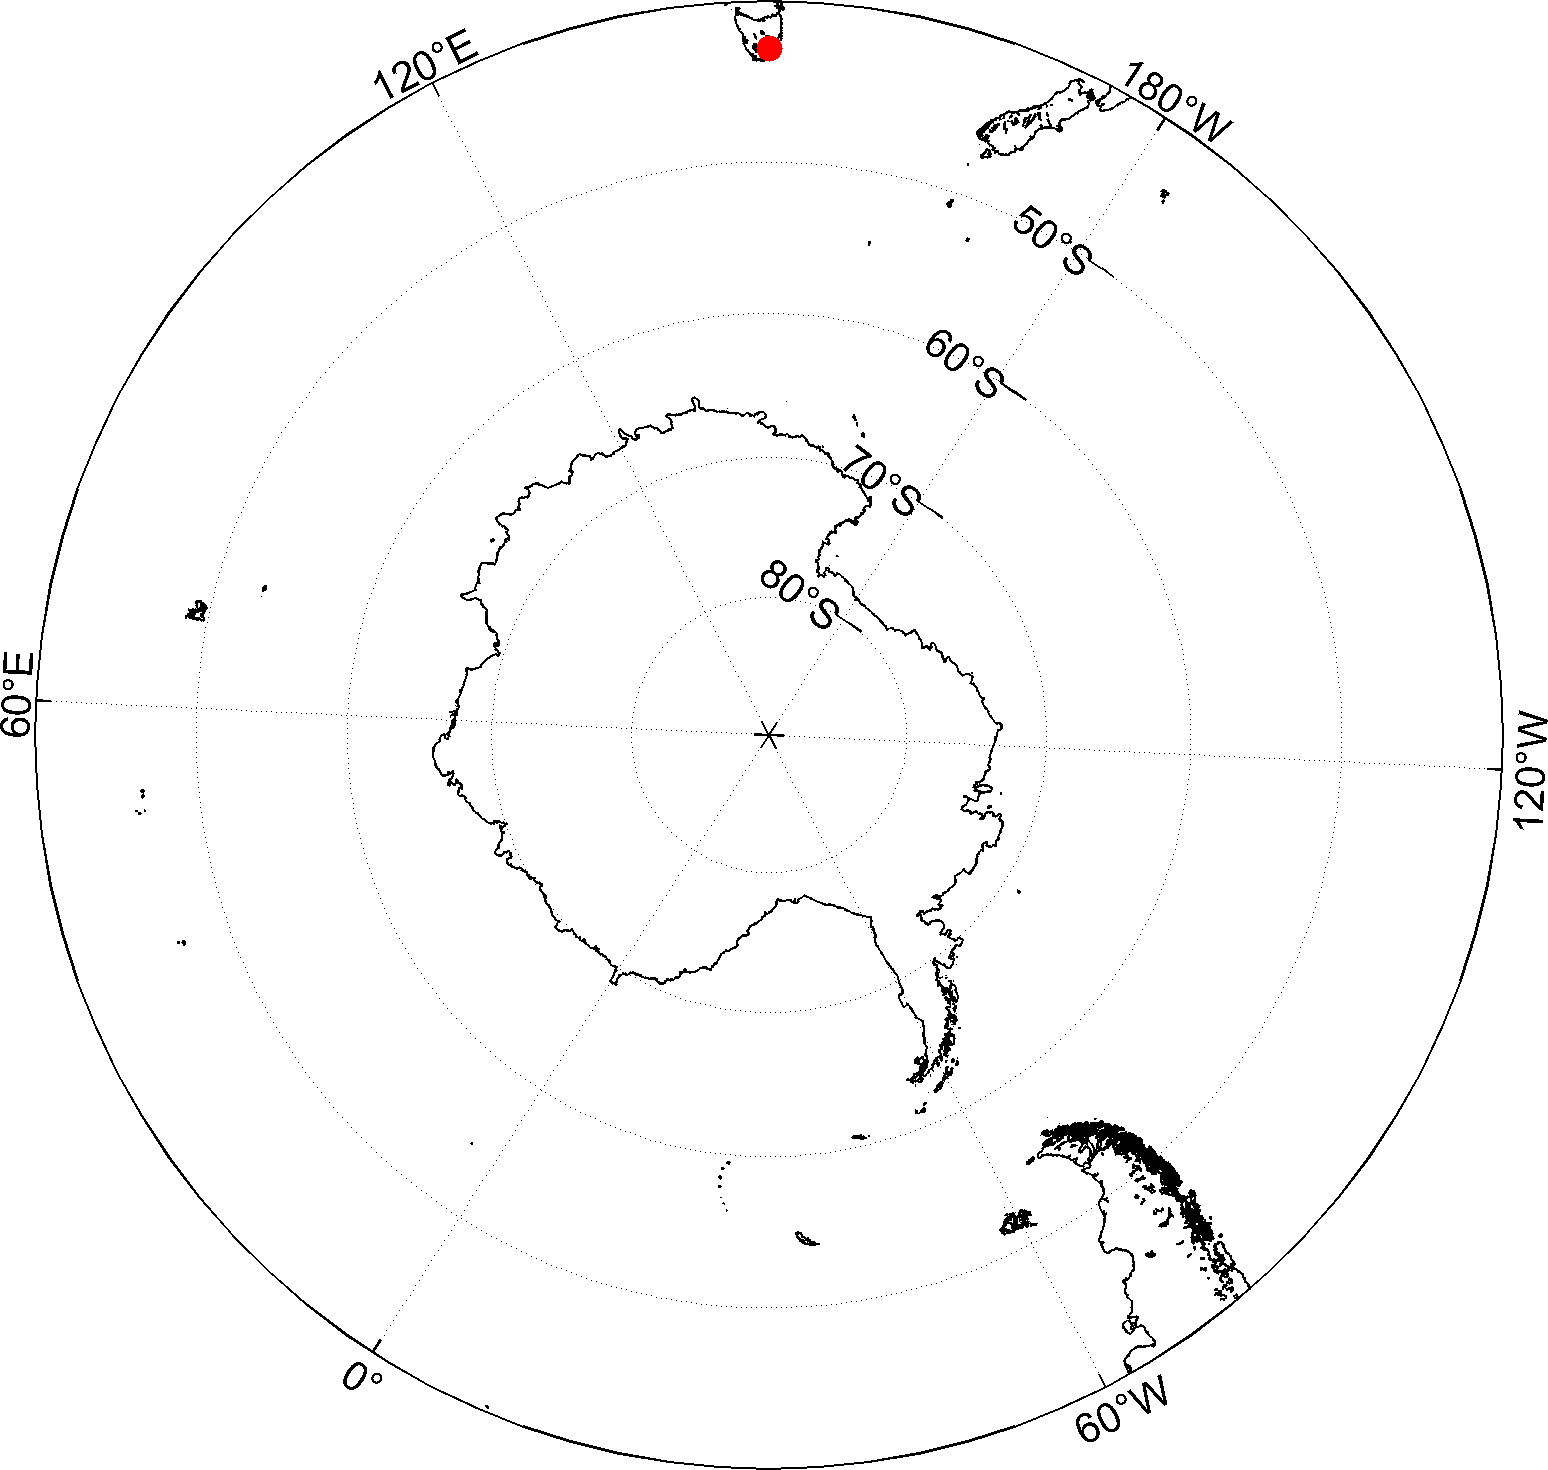
Or, in polar stereographic projection:
% use a stereographic projection centred at 90S, with a radius of 50 degrees,% aligned with 147.32E at the top of the pagem_proj('stereo','lat',-90,'rad',50,'lon',147.32)figurem_gshhs_i('line')hold onph=m_plot(147.32785,-42.901103,'r.');set(ph,'MarkerSize',20);m_grid('XAxisLocation','top') % ensure that longitude tick labels appear% on the outside of the plot, not in the middle
Notes
- requires the Global Self-consistent Hierarchical High-resolution Shorelines data to be installed – see the m_map documentation
- see m_gshhs_i for the ‘save’ option for caching of coastline data – this is much faster if you are plotting the same coastline several times
- the GSHHS provides coastline data at a variety of resolutions (‘help m_gshhs’)
- you can control options such as the font, font size, and tick spacing via the m_grid command (‘help m_grid’)